

Global market snapshot
Equity markets
Loading...
* Date loading. †Exchange capitalization is domestic equity market capitalization in U.S. dollars from the World Federation of Exchanges (May 2026); it is not the capitalization of the displayed benchmark index. U.S. benchmark cards overlap and must not be added together.
Market indicators
Loading...
* “Latest” uses the newest RiskSnap quote. COMEX gold is the active Globex futures contract; its change is versus the prior futures close. Bitcoin trades 24/7. PPI and geopolitical risk are periodic releases.
Foreign exchange
Loading latest rates…
Before the U.S. opening bell
Portfolio and preset pre-market quotes
Choose a preset or a portfolio saved on the Correlations page.
A portfolio can be created in Portfolio Analytics. It is saved only in the user’s browser cache and is not retained by RiskSnap.com.
| Symbol | Shares | EOD | Pre-market | Pre-market change |
|---|
Pre-market applies to eligible U.S.-listed equities and funds. Foreign equities, foreign exchange, futures, indices and Bitcoin display N/A. Missing U.S. pre-market quotes remain unavailable until Yahoo publishes them.
Broker access note: Markets commonly accessible to retail investors through international brokers include the United States (NYSE and Nasdaq), Canada (TMX), United Kingdom (London Stock Exchange), Germany (Deutsche Börse), Japan (JPX), Hong Kong (HKEX), Switzerland (SIX) and Australia (ASX). Mainland China is generally accessed through eligible Stock Connect securities; India, South Korea, Taiwan, Brazil, Dubai and Saudi Arabia may require participating brokers, registration, custody arrangements or local onboarding. Availability varies by jurisdiction, security and account type.
Google News Reuters World News Yahoo Finance
Product coverage
Products covered
Equities - Equity Options - Futures
Markets covered NYSE, Nasdaq, TSX, Australian Securities Exchange, Tokyo Stock Exchange, Euronext Amsterdam and Saudi Exchange; U.S.-listed equity and ETF options; and futures traded on CME, CBOT, NYMEX, COMEX and ICE Futures. Subject to market-data availability.
Futures Rolling front-month futures available using Yahoo Finance symbols are listed below. The contract factor is assigned. If not available the applicable factor must be entered. Rolling futures are used for historical analyses such as HVaR.
| Category | Yahoo Finance continuous futures |
|---|---|
| 🛢️ Energy |
CL=F Crude Oil,
NG=F Natural Gas,
BZ=F Brent,
RB=F Gasoline
|
| 🪙 Metals |
GC=F Gold,
MGC=F Micro Gold,
SI=F Silver,
HG=F Copper
|
| 🌾 Grains |
ZC=F Corn,
ZW=F Wheat,
KE=F KC Wheat,
ZS=F Soybeans
|
| ☕ Softs |
SB=F Sugar,
KC=F Coffee,
CC=F Cocoa,
CT=F Cotton,
OJ=F Orange Juice
|
| 🐄 Livestock |
LE=F Live Cattle,
GF=F Feeder Cattle,
HE=F Lean Hogs
|
| 🪵 Forest Products |
LBS=F Lumber
|
| 📈 Equity indices |
ES=F S&P 500,
NQ=F Nasdaq 100,
YM=F Dow,
RTY=F Russell 2000
|
| 🏦 Interest rates |
ZB=F Treasury Bond,
ZN=F 10-Year Treasury Note
|
Availability is subject to market-data coverage.
Options
Equity Options
Exchange-listed options are available on more than 3,600 U.S. equities and 1,600 ETFs, with expirations ranging from standard monthly and weekly contracts to daily options on selected products. RiskSnap provides option pricing, volatility surfaces and strategy analysis.
Options can be used to earn premium, or to protect against volatility through straddles or to take a directional view. The options strategies section outlines outcomes. Equity Collar Trades are described under structured products.
Thoughts on Risk for the day
Sep 29, 2026
Dispersion
 Dispersion
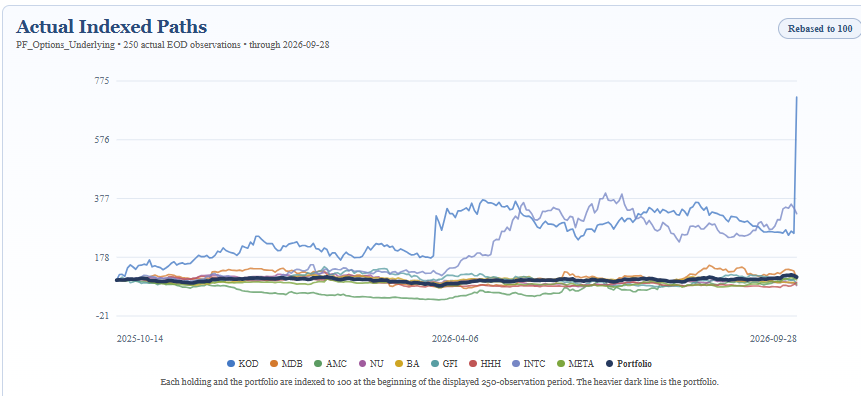
The Dispersion graph can be illuminating. Notice how KOD (Kodiak Sciences) started to disperse a year ago and then continued until it broke out dramatically yesterday.
Sep 17, 2026
Behind the Curve?
 DFF vs CPI
 10Y rates
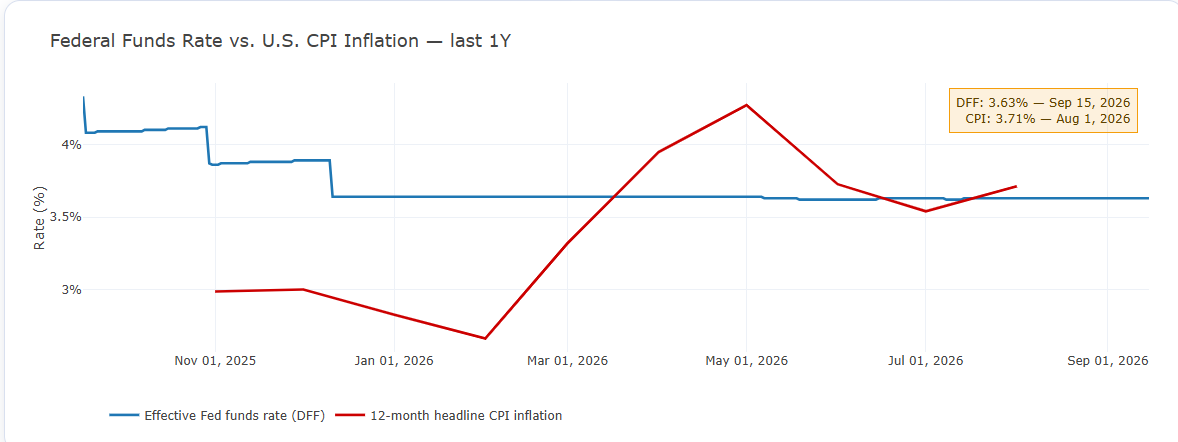
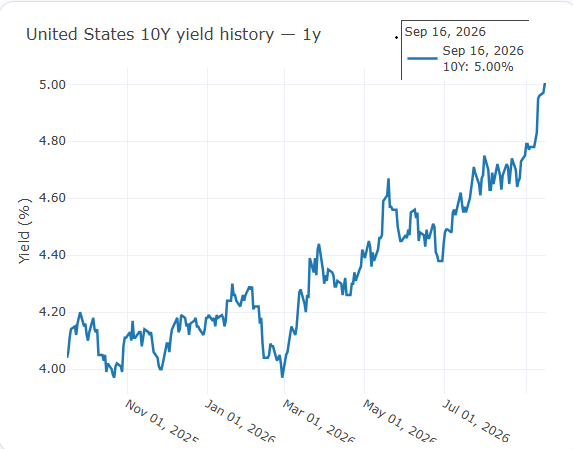
The effective federal funds rate was 3.63% on September 15, below the latest reported 12-month CPI inflation rate of 3.71% for August. With the 10-year Treasury yield near 5% on September 16, markets appear to be pricing continued inflation risk, elevated real rates, or both.
Sep 15, 2026
World Indices negative correlation to Oil and Yields
 Correlations
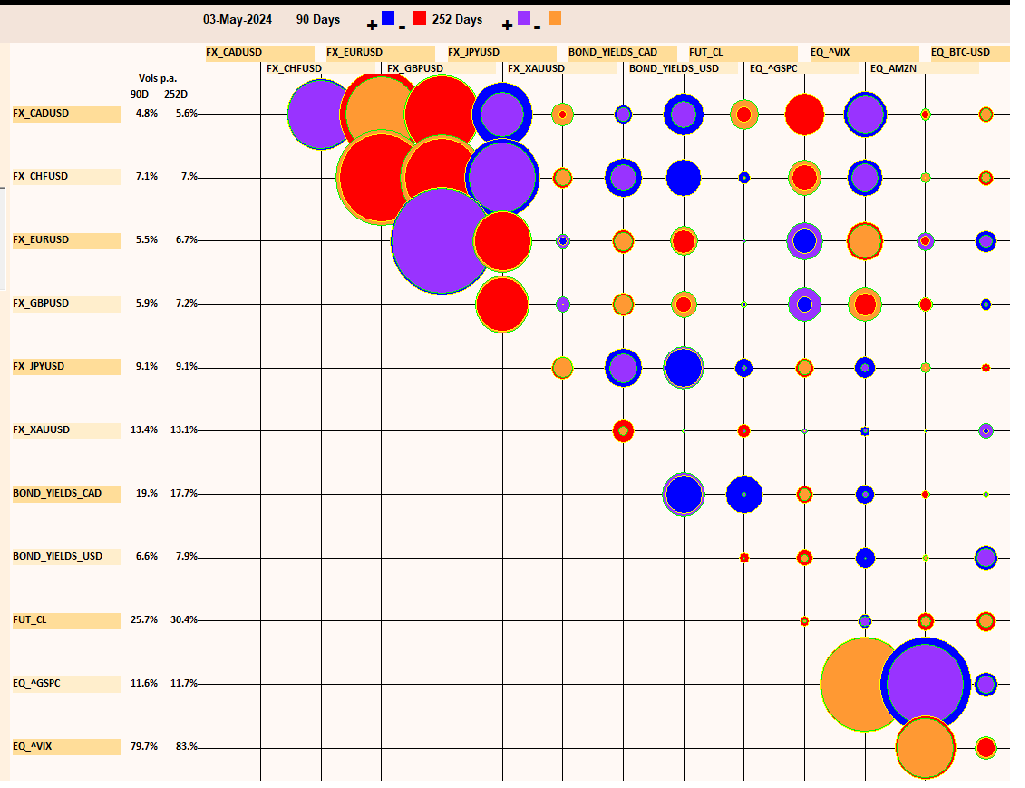
The Correlations screen paints a genuinely negative aversion to higher yields and the higher price of oil. Unfortunately both are indicating inflation problems for non-holders of oil and other commodities. Today's oil price of $104.34 and the US 10 Year Yield breaking 5% and not included in the EOD calculation Sep 11.
The global crude oil market is about $4 trillion per year, depending on oil prices, currently around $100/b, or 100 mb/d [oileyes.com]. When oil spikes from $60 to $100, trillions of dollars shift globally very quickly. It's worth considering how this affects other assets.Sugar’s Energy Connection
 Sugar 11
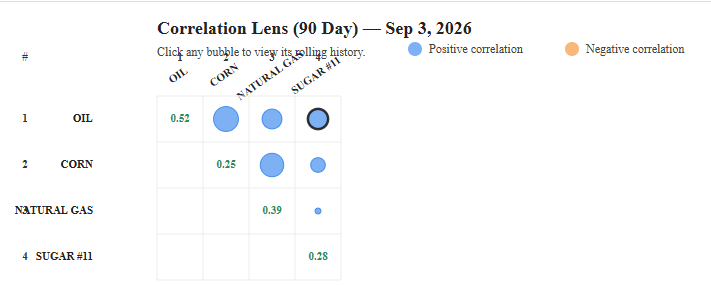
The current rise in oil prices to over $92 per barrel up from $56 per barrel in early 2026, asks what impact can this have on ethanol related commodities. Sugar, for example was heading for a deficit early as April 25, one analytic firm revised its 2025-26 esttimate of a 1.66 million-tonne deficit to a 4.33-million-tonne deficit. "Those are the kind of numbers that have in the past been associated with serious bull markets.." Sugarcane is extensively used to make ethanol, especially in Brazil. Refer to Friedberg's Focus on Futures, May 27, 2026 "Sugar: the bull takes shape". Note that in Nov 1974 after the 1973 oil embargo, sugar reached a high of $.564 per lb. Nearby sugar is $.18 A look at Risksnaps correlations page shows positive correlations between Oil, Natural Gas, Sugar and Corn.
Concentration Risk
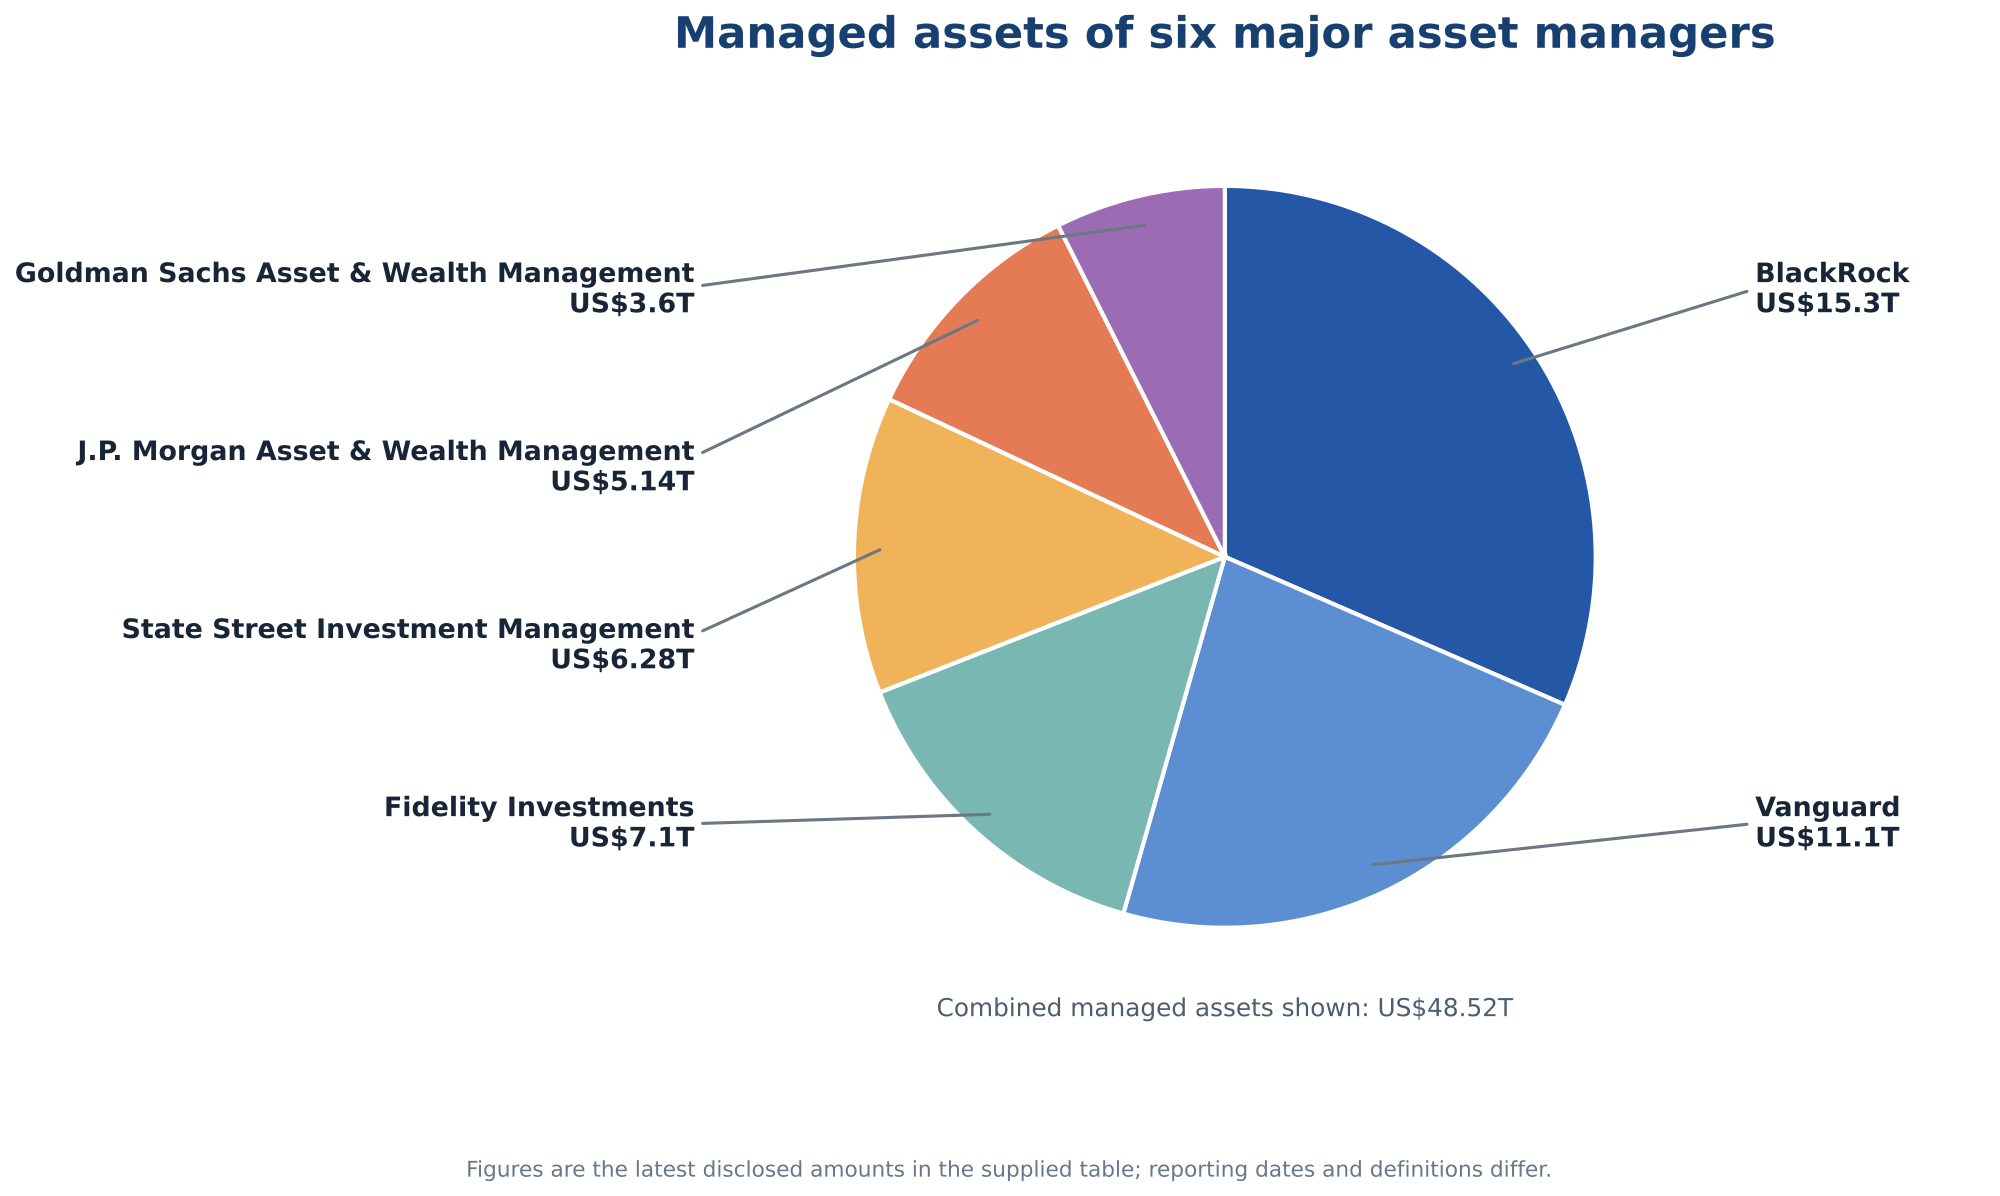 August 31, 2026. There are several layers of concentration . Crypto attracts headlines, principally MSTR and Michael Saylor. The MAG Seven and other AI companies are highly visible. Less discussed is the concentration among the asset managers investing on behalf of funds and other clients.
Unlike exchange-traded securities, these underlying positions are not continuously visible. ETF holdings and mutual-fund net asset values are generally published regularly, while many others are disclosed only periodically. The three large non-bank managers are BlackRock, Vanguard and Fidelity overseeing US$33.5 trillion in asset. Also in the chart are bank affiliated managers: State Street, J.P. Morgan and Goldman Sachs who collectively oversee US$15 trillion . These figures are extraordinary. Although the assets largely belong to clients—and bank depositors are not directly exposed—the scale raises an important question: have some asset managers become systemically important, or even too big to fail?
August 31, 2026. There are several layers of concentration . Crypto attracts headlines, principally MSTR and Michael Saylor. The MAG Seven and other AI companies are highly visible. Less discussed is the concentration among the asset managers investing on behalf of funds and other clients.
Unlike exchange-traded securities, these underlying positions are not continuously visible. ETF holdings and mutual-fund net asset values are generally published regularly, while many others are disclosed only periodically. The three large non-bank managers are BlackRock, Vanguard and Fidelity overseeing US$33.5 trillion in asset. Also in the chart are bank affiliated managers: State Street, J.P. Morgan and Goldman Sachs who collectively oversee US$15 trillion . These figures are extraordinary. Although the assets largely belong to clients—and bank depositors are not directly exposed—the scale raises an important question: have some asset managers become systemically important, or even too big to fail?
During the 2008 financial crisis, Bank of America and other major financial institutions were considered too important to permit a collapse. The Bush administration responded with the US$700 billion Troubled Asset Relief Program (TARP). Asset managers are structurally different from banks, but their enormous size of holdings could still amplify market stress if there was an exit at the same time.
The Treasury has now enlarged its long-term bond-buyback operations.. Scott Bessent, Treasury Secretary indicated a buy back possibly up to $1 Trillion of long term bonds? Would the purchases be sufficient during a severe, concentrated sell-off?
Aug 26, 2026Treasury's Higher-Yield Trap
 Yield Trap
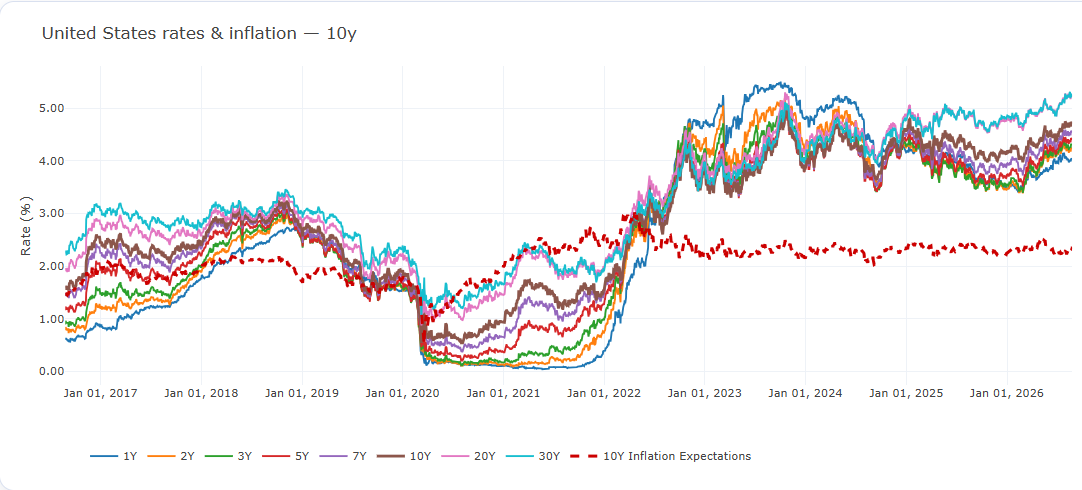
Higher Treasury yields should attract buyers, but the amount of debt that must be financed keeps growing. Large deficits require more issuance; greater supply and fiscal uncertainty make investors demand higher yields; and those higher yields increase the government’s interest expense, adding to future deficits and borrowing needs. The striking feature is that long-term yields have risen sharply while 10-year inflation expectations have remained near 2–2½%. This suggests that inflation expectations alone are not driving the move: higher real yields and term premium—the compensation investors require for holding long-duration government debt—are increasingly important. Treasury buybacks may improve liquidity or alter the maturity mix, but they do not eliminate the financing requirement. Higher yields are increasingly the price Treasury must pay to attract sufficient capital. (Aug 26, 2026) The Rates and Inflation page provides yields for various currencies plus relevant Federal Reserve Statistic
Market Risk Factors
Yield Curves, Inflation and Foreign Exchange
Volatility
The VIX (CBOE Volatility Index) typical ranges: 12-20 normal, 20-30 elevated fear/uncertainty, 30-40 significant stress, 40-60 panic. Currently considered normal. Note the very strong negative correlations between the other markets (with exception of gold) and VIX.
For historical volatilities refer to the diagonal on the correlations matrix at the Correlations page. For implied volatilities refer to our Surface page, where implied volatilities are provided both in 3D graphics and as a grid. The grid filters the available market option prices applying monotonicity, eliminating expiries where there are not enough strikes in the expiry. Extrapolated values are color coded.
Correlations
Correlation covers all risk factors. Some of the most watched risk factors can be found in Correlations page. The page also has a history slider that can be invoked by pressing play.
Dispersion - Portfolios
Dispersion shows how differently the securities in a portfolio are moving. View broad market dispersion or identify individual holdings breaking away from their peers—for example, AMD separating from other AI-related companies. Current and historical dispersion can be viewed on the Dispersion Index page. Dispersion Index page.
Volatility Surface - Equities
Real time implied vol surfaces from market sources can be viewed on Surface page
Gamma - Equities
Gamma is the change in delta and is useful for viewing expected changes in equity prices due to option trading. Gamma walls are also provided in the Gamma page
VaR as a Risk Measure
Value at Risk (VaR) is one of the most popular tools used in risk management and is incorporated within the Basel Accord for banking supervision. VaR is used by central counterparties (CCPs) for purposes of determining initial margin. VaR and Expected Shortfall (ES) are standard measures used by traders for setting risk limits and can be used by investors, traders and risk managers both for preventing panic selling (or buying) in periods of high volatility, and also preventing overreaching in periods of low volatility. VaR calculations can be done on the Portfolio Optimization page.